The Sales Dashboard
This page helps you to understand 'The Sales Dashboard'.
It's part of the 'Sales' getting-started series.
Understanding The Sales Dashboard
This guide helps you to understand the sales dashboard.

Main Column Graph Panels
This section of the guide describes how to read and use the main column graph panels.
There are three graphs:
The following features are common to all three graphs:
Notice the three labels under the filters.

These represent the totals for:
- Sales

- Gross profit dollar

- Gross profit percent

Now notice the graph.

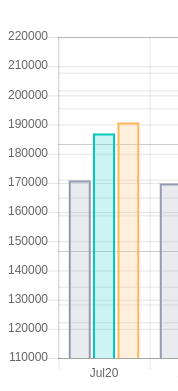
Locate the values on the far left of the graph.
These represent sales total dollar figures.
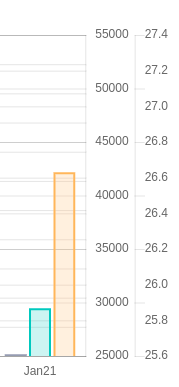
Locate the values on the far right of the graph.
-
The first (inner right) are gross profit dollar figures.
-
The second (outer right) are gross profit percentage figures.
Locate the three coloured columns in the column graph.
They are colour coded to match the three labels from above.
- Sales
- Gross profit dollar
- Gross profit percent

Year To Date Panel
This section of the guide describes how to read and use the 'Year to Date' panel.

Refer to the discussion above about the layout of this column graph.
Now we discuss its filters.
Notice the 'Year to Date' panel.
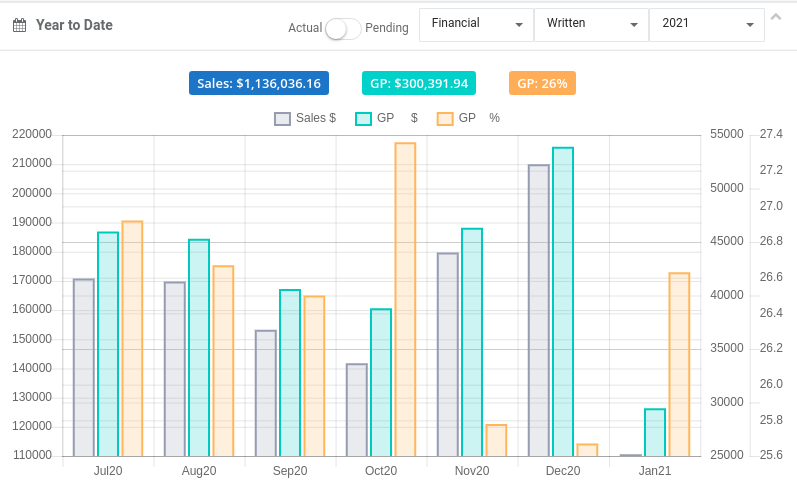
Firstly, locate the filters.

Select the switch to display 'Actual' gross profit totals or 'Pending' gross profit totals.

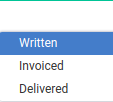
Select an item from the 'Year Type' drop-down.
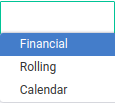
Select an item from the 'Sale Type' drop-down.
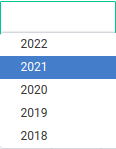
Select a year from the 'Year' drop-down.
Each time you change a filter the graph updates.
Month To Date Panel
This section of the guide describes how to read and use the 'Month to Date' panel.

Refer to the discussion above about the layout of this column graph.
Now we discuss its filters.
Notice the 'Month to Date' panel.
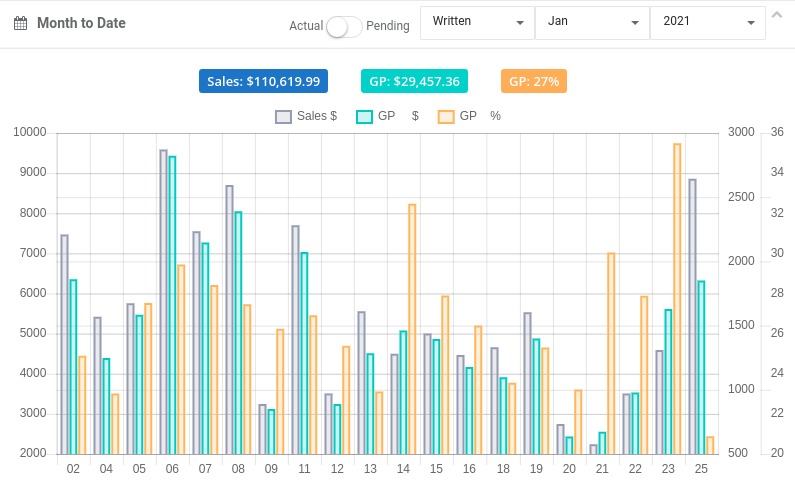
Firstly, locate the filters.

Select the switch to display 'Actual' gross profit totals or 'Pending' gross profit totals.

Select an item from the 'Sale Type' drop-down.

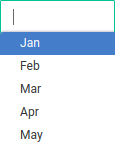
Select a month from the 'Month' drop-down.
Select a year from the 'Year' drop-down.

Each time you change a filter the graph updates.
Week To Date Panel
This section of the guide describes how to read and use the 'Week to Date' panel.

Refer to the discussion above about the layout of this column graph.
Now we discuss its filters.
Notice the 'Week to Date' panel.
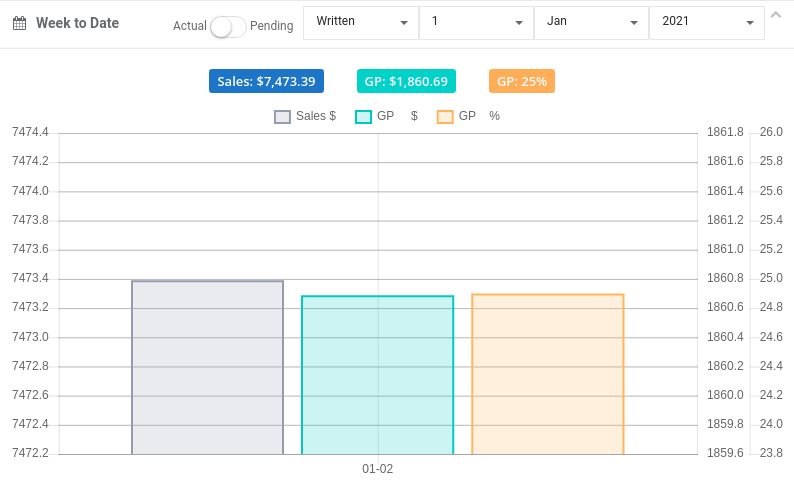
Firstly, locate the filters.

Select the switch to display 'Actual' gross profit totals or 'Pending' gross profit totals.

Select an item from the 'Sale Type' drop-down.

Select a day from the 'Day' drop-down.

Select a month from the 'Month' drop-down.

Select a year from the 'Year' drop-down.

Each time you change a filter the graph updates.
Daily Sales Panel
Notice the 'Daily Sales Panel'.
The daily sales panel is a breakdown of your daily sales.
It displays today's sales only.
The example we use here consists of three sales all at $200 each.
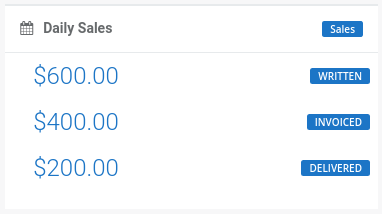
There are three key sections to this panel:
Each of these three sections is considered a 'Sale Progress' stage
The value for each section represents a 'total dollar value' for the current day (today).
We break-down each section below.
Written Sales
Notice the 'Written' value.
The written value is the 'total dollar value' of all items on sales (excluding cancelled sales) for the current day.

Any sale item is considered a 'written sale'.
In this example it's 3 sale items written at $200 each.
Invoiced Sales
Notice the 'Invoiced' value.
The invoiced value is the 'total dollar value' of the invoiced items on sales (excluding cancelled sales) for the current day.

Any invoiced sale item is considered an 'invoiced sale'.
In this example it's 2 sale items invoiced at $200 each.
Delivered Sales
Notice the 'Delivered' value.
The delivered value is the 'total dollar value' of the delivered items on sales (excluding cancelled sales) for the current day.

Any delivered sale item is considered a 'delivered sale'.
In this example it's 1 sale item delivered at $200.
Note
Remember that these figures are a daily value.
They are a count for the current day (today only).
Gross Profit (Dollar) Panel
Notice the 'Gross Profit GP$' section.
There are three key sections to this panel:
Each of these three sections is considered a 'Sale Progress' stage
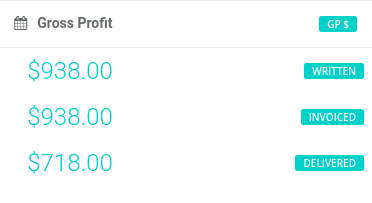
The calculation for 'Gross Profit (dollar)' is:
Sell price - Cost price
Gross Profit (Percent) Panel
Notice the 'Gross Profit GP%' section.
There are three key sections to this panel:
Each of these three sections is considered a 'Sale Progress' stage
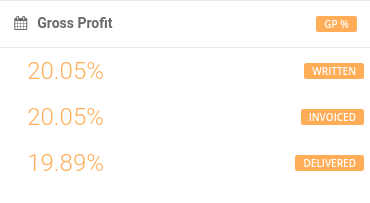
The calculation for 'Gross Profit (percent)' is:
(Sell price - Cost price) / Sell price
Daily Sales By Salesperson Panel
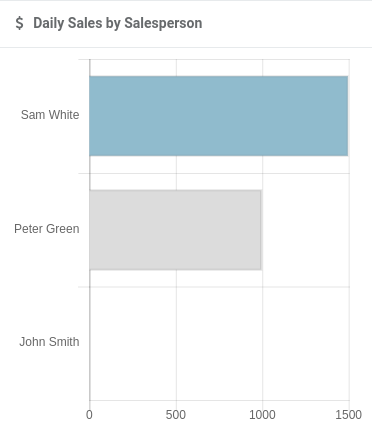
Notice the 'Daily Sales by Salesperson Panel'.
This is a simple bar graph that shows:
- A list of salespeople
- The total dollar value of 'Invoiced sales' for the current day (today)
Calculating Cost Of Sales
In the main menu, go to the Point Of Sale section.
Select 'Sales Dashboard'.
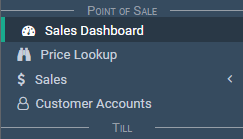
The sales dashboard appears.

Locate the 'Cost of Sales' section.
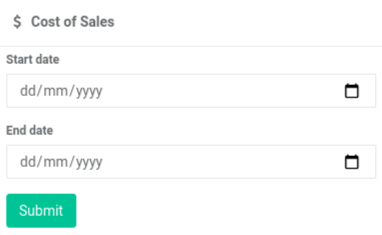
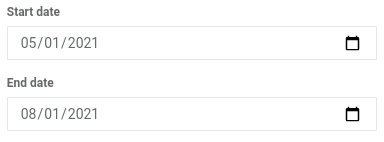
Enter a date range:
- Set a 'Start date'.
- Set a 'End date'.
Select the 'Submit' button.

Notice some figures appear under the dates.
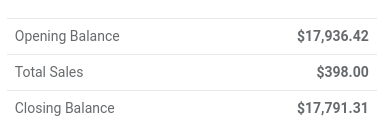
| Value | Description |
|---|---|
Opening Balance |
The stock on hand dollar value at the start date. The calculation uses actual stock price. |
Total Sales |
The dollar figure of stock sold and delivered between the date range. |
Closing Balance |
The stock-on-hand dollar value at the end date. ('Opening Balance' minus 'Total Sales') |
Related Tutorials 
Sales